Square Yards, India’s largest integrated real estate platform, has announced its record financial performance for the fiscal year 2026. In a milestone year of profitable scale, the company delivered revenue of INR 2,086 crore (~USD 223 million), representing 48% year-over-year growth. Equally significant, EBITDA surged to INR 176 crore, a ~3.7x jump year-over-year, with EBITDA margins expanding sharply from 3% to 8%.
| Revenue₹2,086 Cr~$223 Mn▲ 48% Y-Y | Gross Profit₹476 Cr~$51 Mn · Margin 23%▲ 49% Y-Y · +9 bps | Segmental EBITDA₹314 Cr~$34 Mn · Margin 15%▲ 71% Y-Y · +206 bps | EBITDA₹176 Cr~$19 Mn · Margin 8%▲ 269% Y-Y · +504 bps |
Key FY26 Highlights
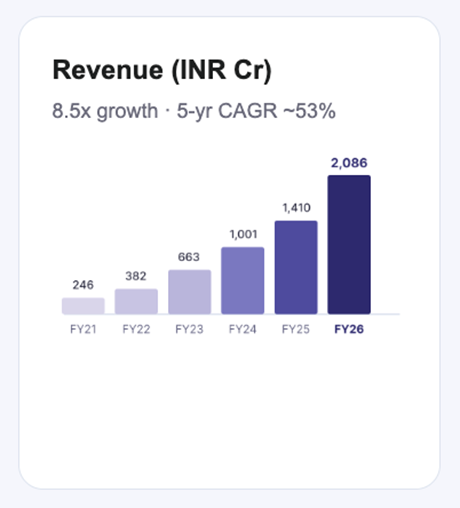
• Revenue Growth: Revenue of INR 2,086 crore (~USD 223 million), up 48% Y-Y, achieving a 5-year CAGR of ~53%. Revenue has grown 8.5x from INR 246 crore in FY21.
• Profitability Milestone: EBITDA of INR 176 crore (~USD 19 million), up ~269% Y-Y, with EBITDA margin expanding 504 bps from 3% in FY25 to 8% in FY26 – the third consecutive year of positive EBITDA.
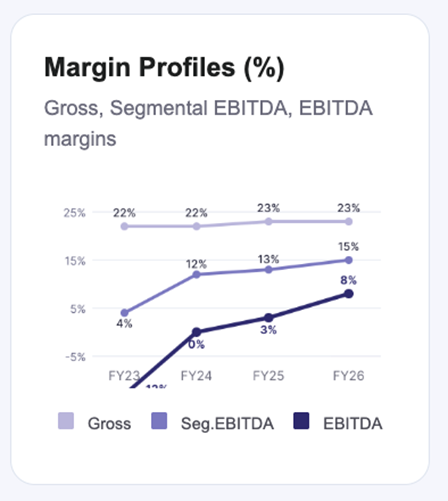
• Gross Profit: Gross Profit reached INR 476 crore (~USD 51 million), growing 49% Y-Y, with gross margins sustained at 23% on a significantly larger revenue base.
• Segmental EBITDA: Segmental EBITDA grew 71% Y-Y to INR 314 crore, with margins expanding from 13% to 15% (+206 bps).
• India remains the engine: India revenue grew 57% Y-Y vs 48% overall, with India now contributing 88% of total revenue. International (GCC + ROW) contributes the balance 12%.
• Q4 Acceleration: Q4 FY26 delivered 53% Y-Y revenue growth, the strongest quarter of the year, setting strong exit momentum for FY27.
• FY27 Outlook: Square Yards targets 40%+ revenue growth and double-digit EBITDA margins for FY27.
” We are at an interesting trisection of scale, growth and profitability. And with network flywheel effects and leverage playing out across the ecosystem, this is the best operational phase we have ever been in. Even with the scale, we are still operating at low single digit market share and that allows us room to think beyond the next 5 years of growth.
— Tanuj Shori, Founder and CEO, Square Yards
Financial Performance Summary
| Particulars (INR Cr) | FY25 | FY26 | Y-o-Y |
| Revenue | 1,410 | 2,086 | 48% |
| Gross Profit | 321 | 476 | 49% |
| Gross Margin | 23% | 23% | 9 bps |
| Segmental EBITDA | 183 | 314 | 71% |
| Segmental EBITDA Margin | 13% | 15% | 206 bps |
| Adjusted EBITDA | 48 | 176 | 269% |
| Adjusted EBITDA Margin | 3% | 8% | 504 bps |
Operational Highlights: Network Effects Across the Ecosystem
| Houses Transacted₹13,236 Cr ~$1.4 BnFY26₹70,000 Cr ~$8.4 Bn till date | Loans Disbursed₹87,831 Cr ~$9.4 BnFY26₹2,15,000 Cr ~$25.7 Bn till date | Homes Designed1,840FY26 projects7,000+ delivered till date | Houses Under Management3,7192,783 rentals in FY26 |
Square Yards facilitated over 2,73,643 customer acquisitions in FY26, underscoring the scale of its distribution engine.
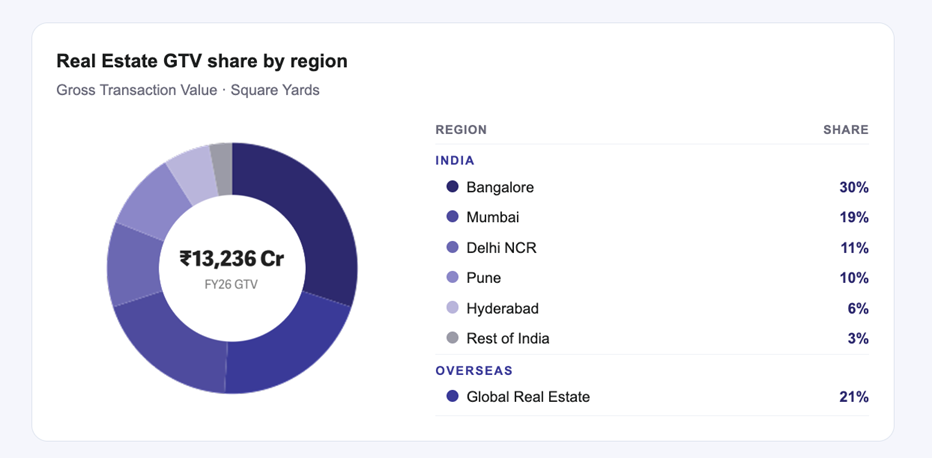
• Real Estate GTV: Houses Transacted worth INR 13,236 crore (~USD 1.6 billion) in FY26; INR 70,000 crore (~USD 8.4 billion) transacted cumulatively to date.
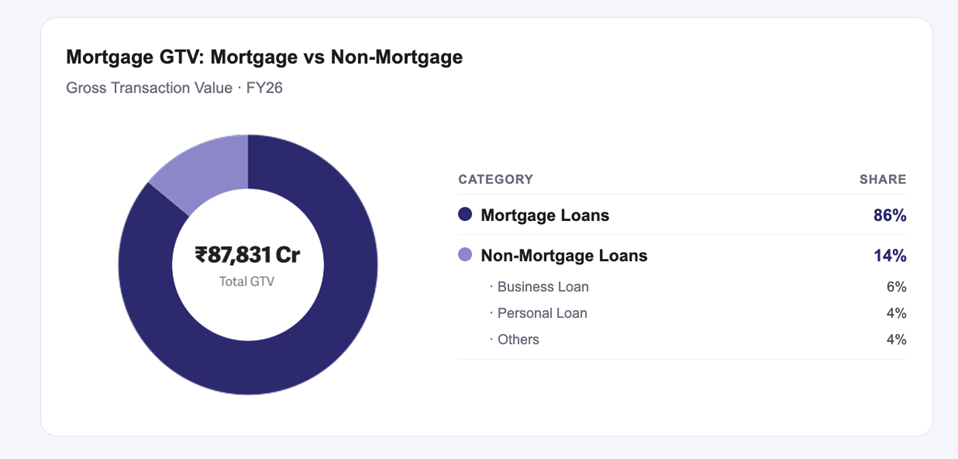
• Mortgage & Fintech Scale: Loans Disbursed of INR 87,831 crore (~USD 10.5 billion) in FY26; INR 2,15,000 crore (~USD 25.7 billion) disbursed cumulatively. Urban Money (fintech subsidiary) is now larger than most private banks in India, barring seven.
• Interior Design: 1,840 homes designed in FY26 (7,000+ delivered cumulatively). Attachment rate reached 55%, showcasing deepening cross-sell across the platform.
• Rental & Property Management Business: 3,719 houses under management, with 2,783 rentals facilitated in FY26.
Revenue Growth Trajectory & Margin Expansion
Square Yards has scaled from ₹246 Cr in FY21 to ₹2,086 Cr in FY26 — an 8.5x growth in just five years, reflecting a 5-year CAGR of ~53%. The business has compounded consistently year-on-year, with revenue nearly doubling between FY25 and FY26 alone. The operating leverage Square Yards has been investing in is clearly playing out across the P&L. Gross Margin held steady at 23% on a much larger base, Segmental EBITDA margin expanded from 13% to 15% (+206 bps), and EBITDA margin stepped up from 3% to 8% (+504 bps).
GTV mix by Region & Product
Bangalore leads real estate GTV share at 30%, followed by Mumbai (19%), Delhi NCR (11%), Pune (10%), and Hyderabad (6%). International (Global Real Estate) contributed 21% of GTV.
Square Yards’ fintech arm Urban Money a total GTV of ₹87,831 Cr in FY26, with mortgage loans commanding an overwhelming 86% share — underscoring the platform’s dominance in home loan distribution. Non-mortgage products contribute the remaining 14%, spread across business loans (6%), personal loans (4%), and others (4%), indicating early but meaningful diversification.