INTRODUCTION
Bridges are an important part of the larger transportation network. Bridge Management System [BMS] forms a critical part of the overall asset management process and it is an essential part of overall, long-term asset management. It is applicable to all existing bridges, old or new. The purpose of management is the maintenance of the bridge, by identifying deficiencies and providing required rehabilitation intervention as required for ensuring the continued safety of traffic. The major tasks in bridge management are:the collection of inventory and inspection data; repair, strengthening, or replacement of components; and prioritizing the allocation of funds. A BMS is a means of managing bridge information to formulate maintenance programs within cost limitations[4,8]. A BMS includes four basic components: data storage, cost and deterioration models, optimization, and analysis models, and updating functions. It is usually done by state agencies and consists primarily of Inspection which is an important step in asset management. First and foremost, the deteriorating condition needs to be identifiedbased on the information collected during visual inspection or by remote sensing.
The recent Morbi bridge collapse was a tragic incident that occurred in Gujarat, India. The 230-meter-long suspension bridge situated on the Machchhu River in Gujarat’s Morbi city was a tourist attraction. This 100+ years old bridge had suffered severe damage.It undergoes rehabilitation intervention. The refurbished suspension bridge collapses within four days after being reopened. The collapse result in the death of at least 140 people and injured many more. The incident caused an immense public outcry and shock, with many people demanding answers as to how such a tragedy could have occurred.
This aged bridge had undergone deterioration over time.Eventually, acatastrophic failure occurred. Incidentally, this bridge like most bridges owned by smaller municipalities and state government departments was not regularly inspected under any BMS regime. Government engineers need to insist on the adoption of Bridge Management Systems (BMS). May be the Morbi suspension walkway catastrophe increases the responsibility of the Bridge Management fraternity and revives the need for immediate and important universal applicability of BMS.Here in lies a shortcoming of the BMS fraternity. The BMS developed to date are dependent upon the internet, requires large capacity servers and the software cannot be used for smaller inventories of bridges. Most BMS, need the allocation of huge financial resources of the department, thereby rendering it inefficient for departments having smaller inventories. This shortcoming exists even after 6 decades of implementation of BMS in the world.
The Daman ganga bridge collapse in 2003, motivated UBMS Research Group [URG] to research the evolution of the world’s first digital Bridge Management system. It was the continued loss of human lives that has been the motivator for URG including the recent collapse of the Morbi Bridge, to work out a solution for owners of smaller inventories.URG resolved to ensure that the smallest department in any country would not be handicapped by shortages of funds, or lack of internet connectivity and technology requirements to implement Bridge Management.
The UBMS Research Group has managed to evolve the solution by shifting to fast-track the software development within 25 days of the collapse of the Morbi bridge. The evolved Software Application for evaluating Analytics in the Bridge Management System, allows the user to know the Balance of service life, Risk involved, and ensures Optimal Fund Allocation. Integration of Structural Health Monitoring, Digital Imagery, and life cycle cost analysis with BMS within the Analytics tool ensures sustainability without compromising the area’s economic growth under the bridge’s influence.
World over Bridge Management Systems are implemented using very high financial resources and require trained engineers to inspect bridges. This makes it difficult, the world over, for owners of smaller inventories to implement BMS. This Application is designed to be able to evaluate the functionality in all geographic areas and all countries of the world, without compromising any of the technical requirements of Bridge Management. Research in India provides the world with a solution to remove all obstacles in the implementation of BMS at the micro level.
IMPLEMENTING GLOBAL ANALYTICS TOOL:
The Global Analytics tool comprises two main subdivisions:
A: Input data fields comprising Inventory data, Inspection data, Cause matrix data, Structural Health Monitoring [SHM] data, and Digital imagery data.
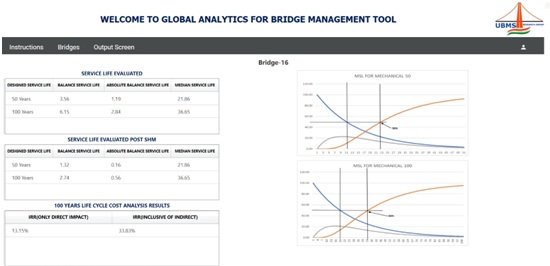
B: Output information comprising of information related to Pre and Post SHM data related to Balance service life, Absolute service life, and Median service life which yields critical information about Risk analysis, Financial results for direct and indirect costs, and investment.
Entire data information is available for micro to the macro inventory of bridges for 10 cycles. If one cycle is conducted every year, the tool is effective for 10 years. This results in the cost-effectiveness of the tool.
A1: Inventory data:
Bridge data collection is the key aspect of BMS; it will provide essential information to improve safety, and accountability for decision-making, extend the service life of bridges and reduce bridge failure. The inventory of the bridge provides us with basic preliminary data related to the ratings of various parameters like Traffic Lane, Age of bridge code, Pay Load, Type of Road, Longitude, Latitude,Date &Time,Length in meters, Total no. of spans, Span Length, etc[1,4,8]. Based on the ratings allocated in inventory, the urgency of the inspection procedure is decided as per the flow chart herein:

A2: Inspection Data:
Several analyses and studies have been conducted using the results of bridge inspections for their systematic operation. For evaluating a long-term maintenance plan, it is necessary to have inspections on the regular basis to manage bridges and predict future deterioration. The fundamental justification for a bridge inspection program lies in the assurance of safety. Inspection is the first step, in which the inspectors check the physical and functional conditions of individual structural members, as well as the entire bridge. Along with the inspectors’ own experience, the condition is assessed using equipment, well-developed tools, and techniques. Based on these observations a judgment about the status of the components with respect to their Structural, Functional, and Socio-Economic is made. This results in the assignment of Ratings for these three parameters. Application of ratings yields us a criterion to determine the condition of the bridge, based on which the rehabilitation intervention to be appliedis designed. The fundamental justification for a bridge inspection program lies in the assurance of safety. Together with the constantly improving technology, the concern to create a balance between the technical prudence of providing rehabilitation interventions and the Financial investments in bridges hasresulted in a demand for optimized fund allocation within bridge management systems [BMS]. This balance is required from ratings Bridge Structural Rating Number [BSRN],Bridge Functional Rating Number [BFRN],and Socio-economic Rating Number [SERN][1,5].
A3: Cause Matrix:
Bridge Management requires a number of key steps, one of which is connecting the symptoms with the cause of distress. The cause of distress is to be determined based on symptoms and its correlation with the cause. This correlation is based on the determination of the source of distress and its correlation with one of the three primary processes, Mechanical [Impact,Abrasion,Erosion,Cavitation,andwear& tear], Physical [Temperature, Shrinkage, Settlement], and Chemical[Chloride, Sulphate,Carbonation,Alkali-Aggregate Reaction].These 11 factors altogether are responsible for the deterioration of elements of any concrete bridge. The bridge inspector will assign ratings from 1 to 5 to each of the probablecauses which result in the observation of distress in the bridge. Theassignment of rating is based on the prognosis established by the bridge inspector. Elimination of each Cause one at a time makes this approach simple. The matrix resulting from this is called the cause matrix.Assignment of ratings to all 11 Causes enables us to decide the primary cause of distress[3,4].The term secondarycauses refer to all other contributing Causes that result in the overall distress in the Bridge Structure. These findings indicate the conclusion of the inspection procedure and to a significant extent, the Input in the Global Analytics tool.
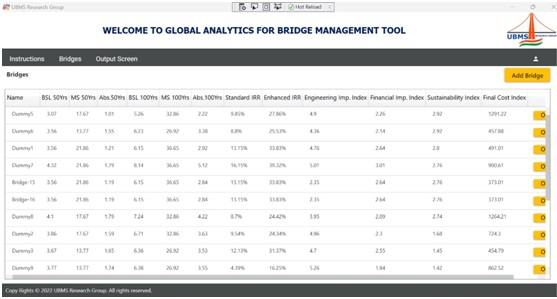
A picture of a typical Input screen is presented here in.
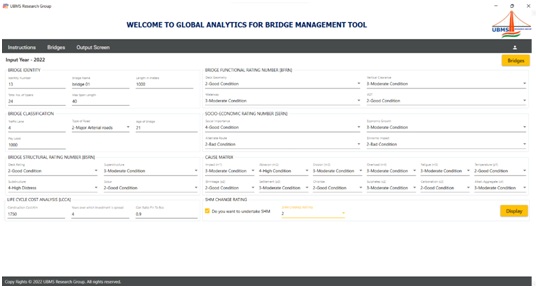
Input within the Global Analytics tool is restricted to meagre 35 odd data fields which are critical for the generation of all the criticalresults essential for the complete functionality of the BMS. This restricted input data field helped us to eliminate the complexity of database structure in conventional BMS, which made it essential to have a high-cost investment for either a Cloud server or a Physical server. These restricted inputs also eliminated the need to have internet-driven BMS.Two fundamental stumbling blocks in the implementation of BMS in every department [small, micro, or large inventory] are eliminated with the advent of the Global Analytics tool. This tool yields results for the basic key functions expected from every BMS.
The key functions of BMS are
- Risk Assessment and Analysis
- Optimization in fund allocations
- Assignment of technically prudent Ranking and Priority process to achieve optimal fund management.
- Risk Assessment and Analysis:
One of the basic objectives of implementing a Bridge Management System is to ensure the safety and continued operation of bridges during the entire life cycle. A bridge management system typically includes a database of information about bridges, inspection and maintenance records, and a system for assessment and monitoring of the risk. This riskarises from a situation of non-provision of required rehabilitation intervention due to a shortage of budgetary provisions.
The general tendency within many BMS application teams is to avoid projecting the risk involved. The approach is to mitigate the risk by allocating funds partially to all bridges. Such fund allocations result in partial elimination of the Cause of distress. This approach is adopted because the team does not have solid technical data to confidently prolong the rehabilitation intervention for non-critical bridge structures. Evolved Global Analytics toolprovides the required level of confidence by ensuring sufficient technical details are evaluatedbyprudent scientific methods. Risk assessment and analysis are based on the evaluation of Balance service life and Absolute balance service life. Correct evaluation of these factors provides the necessary confidence to the team to determine how much the rehabilitation interventions can be prolonged for all bridges which have a lesser degree of distress.
Bridge managers deploy the results from Risk assessment to prioritize their bridge inventory for maintenance and repair, and to develop long-term bridge management plans. It is also necessary to find out the total risk involved within the bridge structure.Based on the output of the cause matrix, risk analysis is generated in which Medium Service Life (MSL), Time of Deterioration, and Actual balance service life (ABSL) are evaluated. Evaluation of Median Service life provides the team with critical information, about the most appropriate time frame in the entire life cycle of the bridge structure when rehabilitation interventions are essentially required[6,7]. This helps in proper budgeting for various bridges in the network. Providing rehabilitation intervention during the small window of time around MSL results in the most effective solution to achieve the next objective of BMS namely the Optimization of fund allocations.
- Optimization of fund allocation
Optimization in fund allocations is a very critical function of any BMS. The best optimization is achieved when remedial intervention is planned in the window of time around MSL. This window during the life cycle is the period when the bridge population, the least rating, and the highest ratings both cross the 50 percent mark [1,5].There is normally a window of a few years around MSL where the BMS team can budget for major rehabilitation interventions. Such budgetary provisions would ensure a maximum increase in service life. Such an increase results in the optimal utilization of funds within any BMS program.
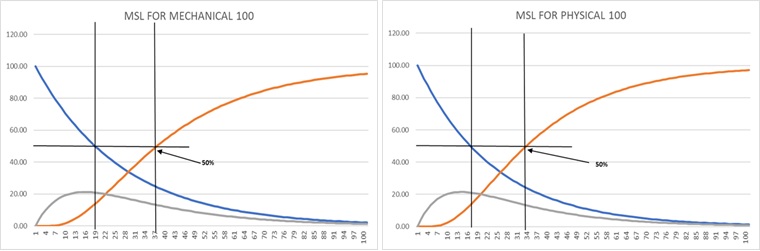

Based on the above graphs for Median Service life evaluation for the three primary processes of deterioration the time window to plan remedial intervention is as follows
| PROCESS | START OF PERIOD | END OF PERIOD |
| MECHANICAL | 19 | 37 |
| PHYSICAL | 17 | 34 |
| CHEMICAL | 13 | 28 |
Thistime window is applicable for all bridges for the 3 processes. The BMS team will have to identify the principal process which is affecting the bridge to determine which of the time window is applicable. This evaluation of the principal process is completed by the Global Analytics tool. It enables the team to get the confidence to plan the budget in a realistic manner. The evaluation of BSL and ABSL further enhances the confidence of the team to manage the Priority to be accorded to a particular bridge in the network.
The uses of Risk Assessment for bridges have been found effective in reducing risk and improving safety. With the help of Risk Assessment identification of bridges that have a high risk is evaluated easily.
Ranking and Priority:
Ranking and Priority is the final and most important step of the Global Analytics tool. This step allows the user to choosea high-riskbridge. The rank of the bridge is decided based on the departmental budget as well as the repair cost assigned to the bridge. Based on ranking and priority procedure, the team defines the bridges for which remedial intervention is provided. Other bridges for which intervention is not provided are designated to a list of Bridges Under Observation and Monitoring. The list of BUOM [Bridges under Observation and Monitoring]are provided with further data collection using short-term Structural Health Monitoring [STSHM] for 3 to 4 monitoring periods not exceeding 72 hours each in a total of one year period. Such STSHM provides critical information about the decrement of performance observed in severely distressed elements of the bridge structure[1,5]. The degree of decrement in performance is recorded in the Global Analytics tool to determine how fast the deterioration process is happening in the bridge. BSL and ABSL are again evaluated based on action observations of STSHM. Integration of SHM with UBMS enables us to shift the decision-making process away from one based on pure engineering judgment. With the actual recording of performance decrement and its application to the evaluation process; we bring in a more prudent scientific approach to BMS.
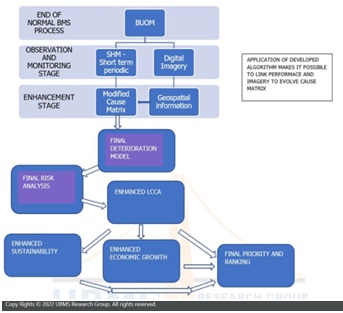

Further innovations within BMS are achieved by adopting an integrated approach to have the option to use Digital imagery to define the precise location of distress in the elements showing severe distress. Periodically collected digital imagery data provide very critical information about the actual increase in observable symptoms of distress. Two types of results from digital imagery are possible within the Global Analytics tool. The facility to upload, save, collate, and retrieve 3D geometric models of entire bridges outlining severe distress elements is possible. Also, by application of Meshroom photogrammetry software,it is feasible to capture individual element records for incremental symptoms of distress in that element. Since photogrammetry tools are applied only to very severe distress elements, the requirements for very high-capacity data storage are eliminated. Individual records as shown in the figures below, eachoccupya few hundred KB of data storage space.


Once digital imagery is used, critical information about the precise geospatial location and nature of distress propagation is captured and available in the Global Analytics tool.
URG has ensured that most of the obstacles observed and put forward by various agencies for the non-implementation of BMS are eliminated. The Global Analytics tool has applicability globally to any BMS, any country, region, or all volumes of inventories [Micro to Macro].
Our commitment to ensuringcontinued innovation is ongoing. Presently research is focused on creating an algorithm for converting observed symptoms to a Cause matrix. The results of this research will provide a huge paradigm shift in the sphere of bridge management globally. URG is committed to Research within India to provide solutions Globally.
We continue our efforts and journey with our focus to bring innovative technologies and apply them toglobally enhance Bridge Management practices.
Reference:
- Sachidanand Joshi, Sitaram Raju Sagi, and others; Handbook for Implementing IBMS/UBMS; India, 2020.
- Sachidanand Joshi, Sitarama Raju Sagi;Enhancement in Indian Bridge Management Systemusing analytics within BIM data model, IDDC Engineers Pvt. Ltd.,Mumbai, India IABSE Symposium Prague 2022 Challenges for Existing and Oncoming Structures May 25-27,2022, Prague, Czech Republic.
- Sachidanand Joshi, Atharvi Thorat, Harshali Dehadray, Mayuri Tundalwar; Paradigm Shift– Performance Driven Bridge Management; Constrofacilitator; 10 August 2022.
- Sachidanand Joshi, Atharvi Thorat, Harshali Dehadray, Mayuri Tundalwar; Towards Performance-Based Dynamic & Real Time BridgeManagement; Constrofacilitator; 25 August 2022.
- Sachidanand Joshi, Atharvi Thorat, Harshali Dehadray, Mayuri Tundalwar; Bridge Management Analytics Aimed to Ensure Sustainability andEconomy; Constrofacilitator; 20 September 2022.
- National Cooperative Highway Research Program, NCHRP Report 713 Estimating LifeExpectancies of Highway Assets, Volume 1.
- National Cooperative Highway Research Program NCHRP Report 483, Bridge Life-Cycle CostAnalysis.
- Ralph Holst,The German BMSas a Decision Tool for Sustainable Maintenance StrategiesFederal Highway Research Institute (BASt), 12 July 2005.