National Institute of Rock Mechanics, Bangalore, India is actively involved in conducting in-situ stress measurements for numerous projects both in India and its neighboring countries for the last 30 years. The stress measurements were conducted at various hydroelectric project sites of Himalayan areas at a depth of 350 m from the surface and recently in-situ stress measurements were carried out at a depth of 600 m from the surface at one of the proposed mining blocks of Singareni Collieries Company Limited which is first time in India. With the available data on in-situ stress measurements, the Stress Map of India has been prepared. This is a significant contribution towards design and development of World Stress Map. These stress orientation directions are advantageously useful not only for academic study and research but also for gathering the enormous information on a global perspective to comprehend the geodynamics and plate movement.
Stress Map of India
In the Geological studies there are several field maps to know the ground features and various geological parameters. If the tectonic stress directions are measured at various available places and marked on Indian map, then it is called as Stress Map of India. Many countries are providing the stress data as a contribution in preparation of World Stress Map. The world stress map shows the orientations of Maximum Principal Horizontal Stress Direction measured at various places in different countries (Heidbach et al. 2016). These stress directions which are pertaining to particular country or on a global scale will be considered as reference points for academic research to know the geodynamics and plate movement.
The Indian subcontinent is an assortment of diverse geological structures such as sedimentary basins, cratons, and mobile belts, causing varied stress regimes (Yadav & Tiwari 2018). Hence the stress map of an area gives the possible indication of Maximum Principal Stress orientation which is regional in nature. Therefore, this orientation data cannot be taken into consideration for design purpose in any major underground mining or civil engineering projects. The fresh data should be collected for determining the stress measurements as case-to-case basis for a required orientation for any precise engineering purpose. Sometimes the stress orientations under consideration will be influenced by regional tectonic features such as faults, shear zones, presence of dykes etc. These orientations may be considerably varied in magnitude and directions from the trends as these are perturbed in nature.
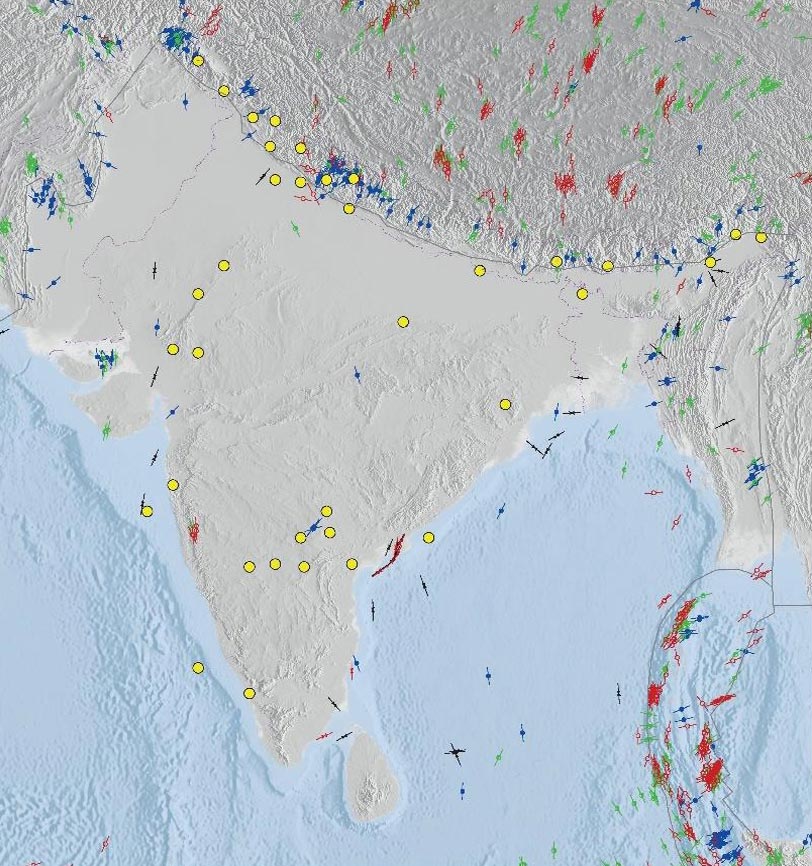
There are two types of stresses available based on the regional and local scales. Regional stresses are also called as First order estimates which are based on the measurements of earthquake focal mechanism studies at the particular site globally or regionally. But the second order stresses are completely of local parameters generally carried out by deep hole hydrofracturing method, overcoring method for particular engineering purpose on case-to-case basis (Figure 1). However, the first and second order stress directions are mapped on the world stress map to know the possible global phenomenon in terms of plate dynamics etc. The Stress Map of India is being prepared by National Institute of Rock Mechanics (NIRM), mainly focusing on second order stress data that was generated for the last 30 years from various parts of the country. The data has been collected from various underground openings where in-situ stress measurements have been conducted by hydrofracture method. Some of the data was generated from overcoring measurements that have been conducted at underground mines and borehole breakout data that was collected from various boreholes during the course of 30 years of journey. Many of these measurements have been made for specific engineering applications (e.g., underground powerhouse orientation evaluation, mining work etc.), These orientations are quite homogeneous in broad regions except in few places where
the geological anomalies occurred. In these regions where there are some geological anomalies, the horizontal stress directions seem to be completely incoherent from site to site as topography, geological disturbances like faults and dykes or nearby excavations could strongly perturb the regional stress field at these places. This anomalous data is therefore not worth considering for incorporating in the stress map and cannot be the reference to the study of present-day plate dynamics. Hence the perturbed stress data is omitted in the preparation of Stress Map.
Observations of Stress Map of India
Nearly 300 reliable indicators of the orientation of horizontal stress in the Indian crust have been measured at different depths to explain the regional trends of stress orientations across India (Table- 1). Stress provinces were demarcated based on the trajectories throughout the country. This data has been correlated with reference to the motion of Indian plate. The possible regional pattern of stress in Indian sub-continent with reference to the first order stress, and also a number of locally measured stress orientations influenced by second-order sources of stress such as structure and topography with reference to the present-day plate dynamics, have been correlated.
Table-1 Data Collected from different parts of the country
| Place | Locality | Latitude | Longitude | Test | Depth in m | Local Magnitude MPa | Reg ime | Quali ty | Direction |
| India | Dibang Valley District, Arunachal Pradesh | 28036’33”N | 95052’21”E | HF | 307 | 12.67 | SS | A | N500 |
| India | Uttarakashi District, Uttarakhand | 31003’35”N | 78005’43”E | HF | 144 | 7.45 | TF | A | N400 |
| India | Kinnaur District, Himachal Pradesh | 31032’30”N | 78016’50”E | HF | 191 | 16.125 | TF | A | N1500 |
| India | Singtam, Sikkim | 27009’00”N | 88022’48”E | HF | 185 | 7.52 | SS | A | N1600 |
| India | Mangan, North District, Sikkim | 27°31’44″N | 88°32’26″E | HF | 518 | 13.67 | SS | A | N300 |
| Bhut an, Near to India | Trongsa District, Bhutan | 27°15’59″N | 90°31’32″E | HF | 150 | 8.38 | TF | A | N700 |
| India | Sangareddy, Telangana | 17°37’28″N | 78° 05’17″E | HF | 100 | 8.07 | SS | B | N300 |
| Bhut an, Near to India | WangdiPhodra ng District, Bhutan | 27°27’20″N | 90° 04’28″E | HF | 100 | 7.14 | SS | A | N1500 |
| India | West District, Sikkim | 27°17’41” | 88°17’31″E | HF | 150 | 2.13 | TF | A | N500 |
| India | Udaipur, Rajasthan | 24°17’52″N | 73°46’02″E | HF | 62 | 7.74 | TF | A | N1400 |
| India | Vedanta, Rajasthan | 26°02’28″N | 74°01’11″E | HF | 557 | 36.88 | TF | A | N1200 |
| India | Chamoli District, Uttarakhand | 30030’50”N | 79029’30” | HF | 60 | 5.19 | SS | A | N300 |
| India | Chamoli District,Uttara khand | 30° 30′ 0” N | 79° 30′ 0” E | HF | 150 | 5.93 | SS | A | N400 |
| India | Doda District, Jammu & Kashmir | 33°10’58″N | 75°18’53″E | HF | 365 | 5.48 | SS | A | N500 |
| India | Kashmir | 33°17’12″N | 75°45’43″E | HF | 80 | 9.7 | TF | A | N400 |
| India | Sikkim | 27°23’59″N | 88°31’10″E | HF | 239.67 4 | 8.95 | SS | A | N1100 |
| India | Dehradun, Uttarkhand | 30°32’04″N | 77°57’39″E | HF | 90 | 8.2 | TF | B | N700 |
| India | Shimla District, H.P | 31005’40”N | 77047’15”E | HF | 150 | 8.855 | SS | A | N1400 |
| India | Udaipur, Rajasthan | 24.95°00”N | 74.13°00”E | HF | 504 | 22.76 | SS | A | N300 |
| India | Malana, Himachal Pradesh | 32°03’42″N | 77°15’40″E | HF | 100 | 3.15 | SS | A | N500 |
| India | Dibang, Arunachal Pradesh | 28°48’45″N | 96°09’05″E | HF | 270 | 10.125 | SS | A | N1500 |
| India | Ramban District, Jammu & Kashmir | 33009’43”N | 75019’40”E | HF | 258.68 7 | 5.62 | NF | A | N400 |
| India | Shimla &Kullu, H.P. | 31026’00”N | 77039’00”E | HF | 107.3 | 7.29 | TF | A | N1500 |
| India | Chamba District, H.P. | 32024’00” | 76012’00”E | HF | 9.9 | SS | A | N400 | |
| India | Kishtwar, Jammu | 33022’06” N | 75047’55” E | HF | 132.37 | 9.7 | TF | A | N400 |
| India | Chungthang, Sikkim | 27°36’29″N | 88°38’36″E | HF | 156 | 8.5933 | TF | A | N153.030 |
| India | Joshimath, Uttarakhand | 30°39’26″N | 79°31’01″E | HF | 248 | 9.64 | SS | A | N400 |
| India | Bhatwari, Uttarakhand | 30° 49′ 0″N | 78° 37′ 0″E | HF | 100 | 6.606 | TF | A | N500 |
| Bhut an, Near to India | ChukhaDzongk hag, Bhutan | 26°52’14″N | 89°34’55” | HF | 410 | 14.205 | SS | B | N1300 |
| India | Upper Subansri District, Arunachal Pradesh | 27°47’12″N | 94°20’09″E | HF | 270 | 8.61 | SS | A | N1700 |
| India | Kullu District, H.P. | 31°45’03″N | 77°14’32″E | HF | 240 | 15.78 | SS | A | N600 |
| India | Bhunter, H.P. | 31°51′36″N | 77°09′00″ E | HF | 416.79 | 15.45 | SS | A | N600 |
| India | Joshimath, Uttarakhand | 30°40’21″N | 79°30’48″E | HF | 248 | 11.966 | SS | A | N200 |
| India | Manali, H.P. | 32° 16′ 12″ N | 77° 10′ 12″ E | HF | 180 | 7.329 | SS | A | N500 |
| India | Bhunter, H.P. | 31°51′36″N | 77°09′00″ E | HF | 100 | 3.15 | SS | A | N500 |
| India | Nilgiri District, T.N. | 11° 25′ 0″ N | 76° 41′ 0″ E | HF | 532 | 26.5 | SS | A | N1000 |
| India | KalvarPadavu, Karnataka | 12° 52′ 12″ N | 74° 52′ 48″ E | HF | 106.5 | 6.82 | TF | A | N1500 |
| India | Love Garden, Visakhapatna m | 17° 39′ 40″N | 83° 15′ 47″ E | HF | 147.2 | 9.17 | TF | A | N200 |
| India | Rohru Tehsil, H.P. | 31005’42”N | 77047’16”E | HF | 150 | 8 | SS | A | N1400 |
| India | Mora, Maharastra | 18°53′20″N | 72°56′02″E | HF | 107 | 25.5 | TF | A | N1300 |
| India | Bhatwari, Uttarakhand | 30° 49′ 0″N | 78° 37′ 0″E | HF | 144 | 7.05 | TF | A | N500 |
| India | Mangalore, Karnataka | 12°52′00”N | 74°53′00”E | HF | 146.57 | 6.22 | TF | A | N1400 |
| India | Pithoragarh District, Uttar Pradesh | 29°58’41″N | 80°34’21″E | HF | 255 | 3.09 | SS | A | N1400 |
| India | Hutti, Karnataka | 16°12’05″N | 76°38’57″E | HF | 721 | 23.54 | SS | A | N200 |
| India | Srisailam Andhra Pradesh | 16°05’13″N | 78°53’50″E | HF | 231 | 9.77 | TF | A | N500 |
| India | Srinagar, Jammu & Kashmir | 34°08′40″N | 74°11′08″E | HF | 310 | 9.16 | SS | A | N1300 |
| India | Kinnaur District, Himachal Pradesh | 31°30′00″N | 78°10′39″E | HF | 269 | 3.79 | SS | A | N100 |
| India | Bihar | 22°38′00”N | 86°22′00”E | HF | 200 | 12.95 | TF | A | N500 |
| India | Kinnaur District, Himachal Pradesh | 31°25’50” | 78°14’28″E | HF | 259.68 | 10.8 | SS | A | 180(N-S) |
| India | Khetri, Rajasthan | 27°59′00” | 75°48′00”E | HF | 300 | 8.89 | TF | A | N300 |
| India | Kinnaur District, Himachal Pradesh | 31°33’50″N | 77°58’49″E | HF | 300 | 10.22 | SS | A | N300 |
| India | Kinnaur District,H.P | 31°33’50″N | 77°58’49″E | HF | 190 | 7.5 | SS | A | N100 |
| India | Mumbai, Maharastra | 19°22′22′′ | 73°50′04′′ | HF | 200 | 6.24 | SS | A | N1400 |
| India | Arunachal Pradesh | 28°08′40″N | 95°50′30″E | HF | 247.75 | 10.98 | TF | A | N300 |
| India | Nepal | 27° 42′ 43.2756” N | 85° 18′ 46.62” E | HF | 150 | 7.21 | TF | A | N200 |
| India | Bhutan | 26°52’14’N | 89°34’55″E | HF | 140 | 14.2 | TF | A | N500 |
| India | Trongsa district, Bhutan | 27°26’54”N | 90°22’24”E | HF | 327 | 12.24 | SS | A | N600 |
| India | Nilgiri District, T.N. | 11° 25′ 0″ N | 76° 41′ 0″ E | HF | 532 | 10.782 | SS | A | N1100 |
| India | Mahabubnaga r District, Telangana | 16 44′ 15 ” N | 78° 0′ 29” E. | HF | 82 | 3.044 | SS | A | N500 |
| India | Uttarakashi District, Uttarakhand | 31003’35”N | 78005’43”E | HF | 164.5 | 5.62 | SS | A | N400 |
| India | Telangana | 16 44′ 15 ” N | 78° 0′ 29” E. | HF | 60 | 2.541 | TF | A | N500 |
| India | Telangana | 16 44′ 15 ” N | 78° 0′ 29” E. | HF | 130 | 5.46 | TF | A | N300 |
| India | Joshimath, Uttarakhand | 30°40’21″N | 79°30’48″E | HF | 414 | 11.966 | SS | A | N20° |
| India | Dibang Valley District, Arunachal Pradesh | 28036’33”N | 95052’21”E | HF | 166 | 8.52 | SS | A | N500 |
| India | Chamoli District, Uttarhand | 30°15’00”N | 80°15’00”E | HF | 226 | 8.14 | SS | A | N1300 |
| India | Warangal Nalagonda district,Telang ana | 18° 2′ 8.4084” N | 79° 32′ 14.6364” E | HF | 92 | 3.02 | SS | A | N1000 |
| India | chamoli district of Uttarakhand | 38° 53′ 36.42” N | 77° 0′ 52.956” W | HF | 205 | 7.146 | SS | A | N1200 |
| India | Mahabubnaga r district, Telangana | 16° 45′ 20.844” N | 77° 59′ 58.056” E | HF | 96 | 4.245 | TF | A | N400 |
| India | Raichur District, Karnataka | 16°11’49.5″ N | 76°39’06.2″ E | HF | 832.69 | 25.635 | SS | A | N800 |
| India | Nalgonda districts, Andhra Pradesh | 16° 14′ 18.06” N | 80° 38′ 31.848” E | HF | 70 | 2.94 | TF | A | N1000 |
| India | Himachal Pradesh | 32°14 ‘ 00’ ‘ N | 77°13′ 00′ ‘ E | HF | 180 | 7.329 | SS | A | N1400 |
| India | Pithoragarh District, Uttar Pradesh | 25° 21′ 45.36” N | 82° 11′ 23.64” E | HF | 105 | 2.864 | SS | A | N20° |
| India | Mumbai, Maharastra | 19°22′22′′ | 73°50′04′′ | HF | 200 | 8.31 | SS | A | N1400 |
| India | Singareni Collieries | 17° 21′ 30.24” N | 78° 31′ 17.184” E | HF | 596 | 17.798 | TF | A | N20° |
| India | Kullu District, H.P. | 31° 54′ 46.08” N | 77° 10′ 27.4836” E | HF | 100 | 7.42 | TF | A | N35° |
| India | Mandamarri Telangana | 18° 58′ 45.12” N | 79° 28′ 50.16” E | HF | 300 | 4.08 | NF | A | N18° |
| India | Godavarikhani Telangana | 18° 45′ 36.432” N | 79° 30′ 45” E | HF | 250 | 5.3 | SS | A | N15° |
| India | Godavarikhani Telangana | 18° 45′ 36.432” N | 79° 30′ 45” E | HF | 450 | 3.13 | NF | A | N24° |
| India | Bhupalpally telangana | 17° 52′ 29.35” N | 79° 31′ 15.6144” E | HF | 300 | 3.2 | NF | A | N100 |
| India | Bhupalpally telangana | 17° 52′ 29.35” N | 79° 31′ 15.6144” E | HF | 320 | 9.52 | SS | A | N500 |
| India | Bhupalpally telangana | 17° 52′ 29.35” N | 79° 31′ 15.6144” E | HF | 360 | 1.7 | NF | A | N500 |
| India | 31°25’50” | 78°14’28″E | Thru st fault | 180 | TF | ||||
| India | 31°33’50″N | 77°58’49″E | strik e fault | 125 | SS | ||||
| India | 33°17’12″N | 75°45’43″E | Thru st fault | 45 | TF | ||||
| India | 22°38′00”N | 86°22′00”E | Nor mal Fault | 120 | NF | ||||
| India | 30°32’04″N | 77°57’39″E | Dyke | 100 | Dyk e |

Based on the regionally consistent orientations, three stress provinces are established in a broader term (Figure 2) viz., the Himalayas, Mid-continent, and Southern shield. The extreme North part of India where Himalayas are existing, the maximum data collected which show Maximum Horizontal Principal Stress direction (σH) varying from N20°E to N30°E. These horizontal σH orientations are derived from the data generated from the Indian States of Himachal Pradesh, Jammu & Kashmir, Uttaranchal, Sikkim, Arunachal Pradesh and from Bhutan. In the central part of India, the average σH orientation is derived from the data generated from the measurements around Aravalli region, Hyderabad and part of Eastern Ghats. The average orientation is N10°-20°W. In the Shield area theaverage σH orientation which is N20°E, is the result of data compiled from KGF (Karnataka), Mumbai and Mangalore (Karnataka). The thick Indian lithosphere is associated with far field tectonic forces allow the stress field to be more easily perturbed by local effects of geological discontinuities like great thrusts of Himalayas and topography (Gowd T N, et al, 1992).
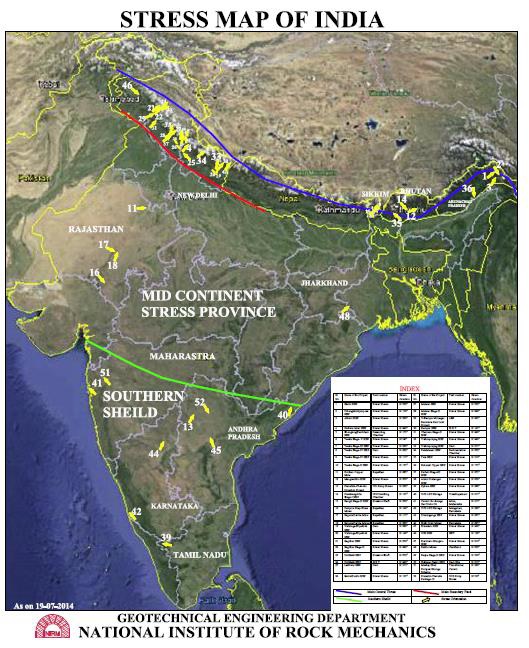
Figure 2, Index map of India showing the physiographic/tectonic provinces referred in this paper. The arrows indicate the maximum compressive horizontal stress (σH max) orientation as generated from hydrofracturing stress measurements. The lines indicate different stress provinces as revealed by stress analysis. The in-situ stress orientation data was collected from the hydro-fracture measurements, borehole breakouts and focal mechanisms data from different part of India. The data was in turn compared with the other countries who provided for preparation of world stress map (Zoback MD et.al 1985) and observed that Maximum landmasses from different continents reveal parallel stress orientations to absolute plate velocity. This argument leads to the assumption that Maximum Horizontal Principal Stress (σH) orientations are the consequence of dominant plate driving forces that are acting along plate boundaries (Zoback ML1992). But apparently, the stress orientations derived from India and Australian continents are not consistent and not abide by the absolute plate velocity implying that plate boundary forces are not adequate or sufficient to understand intraplate stress (Dyksterhuis et al. 2005a, b; Heidbach et al.2007; Jade et. al 2017). This clearly indicates that the Indian subcontinent is portrayed by scarce distributions of the σH orientations (Figure 2), and therefore, Yadav and Tiwari modeled the orientations and magnitude of Maximum Horizontal Principal Stress (σH) through finite element modeling integrating heterogeneities in elastic property of the Indian continent and plain stress calculation to understand the inconsistency of σH. They have considered four different situations in their simulation studies, these are
- homogeneous plate with fixed plate boundary
- homogeneous plate with boundary forces
- heterogeneous plate with fixed boundary
- heterogeneous plate with boundary forces
The estimated orientation and magnitude of Maximum Horizontal Principal Stress σH with a heterogeneous plate with boundary forces in the Himalayan region and an eastern plate boundary comprising the Indo-Burmese arc and Andaman subduction zone are reliable and consistent with measured maximum horizontal stress data that was provided by NIRM. This study suggests that plate boundary force varies along the northern Indian plate margin and also indicates a constraint on the intraplate stress field in the Indian subcontinent (Yadav & Tiwari 2018).
Conclusions
The data generated from nearly 300 consistent indicators of the orientation of horizontal stress in the Indian crust have been gathered to explain the provincial trends of stress orientations across India. Stress provinces were demarcated based on the trajectories all over the country. This data has been correlated with reference to the movement of Indian plate. The possible regional pattern of
stress in Indian sub-continent with reference to the first order stress, and also a number of locally anomalous stress orientations influenced by second-order sources of stress such as structure and topography with reference to the present-day plate dynamics, have been correlated (Subrahmanyam DS 2014).
In general, the σH orientation is NNE-NE throughout the Central and Northern India with a mean direction of about N230 E. This orientation is sub parallel to the direction of compression expected from the forces present along the Himalayan collision, which resist the northward movement of the Indo Australian Plate. There is however a large amount of scatter in σH orientations throughout the Indian subcontinent suggesting that some of the stress indicators reflect local sources of stress rather than the collisional tectonics.
The Himalayas where we are having maximum data (Around 150) is having orientation varying from N200– 300E. In the central part of India, the average orientation N100-200W is derived from the data generated from the measurements around Aravalli region, Hyderabad and some parts of Eastern Ghats. In the Shield area, the average orientation – N200E, is the result of data compiled from Kolar Gold Fields (Karnataka), Mumbai and Mangalore. The thick lithosphere in India is associated with far field tectonic forces allow the stress field to be more easily perturbed by local effects of geological discontinuities like great thrusts of Himalayas and topography.
Based on the studies, it has been emphasized that the mean orientation is N25°E which shows clear correlation with the direction of motion of the Indian plate.
Dr. Oliver Heidbach who is Head of the World stress Map project will be compiling data generated by National Institute of Rock Mechanics to prepare World Stress Map, which is expected to be released by this year-end 2023. Figure-3 shows the rough sketch of Stress Map prepared by WSM.

The database that is available from Stress map of India will not only be beneficial in academic research but also for commercial and economical investigations. In academic research, this data will contribute to know the possible movement of plate tectonics. The stress map of India will be updated periodically by incorporating data acquired not only from NIRM, but other organisations like CSMRS, NGRI etc for next update in the year 2023.
Acknowledgments
The author is thankful to Dr. H.S. Venkatesh, Director, National Institute of Rock Mechanics (NIRM), for his encouragement. Also thankful to Dr. S. Sengupta, Scientist & Head (Rtd), NIRM for providing necessary inputs. Also thankful to Mr. G. Shyam, Mr. K. Vamshidhar and Mr. Vikram Shankar for their constant encouragement and support.
About the author
Dr DS Subrahmanyam is the Head of the department for Geotechnical Engineering Division, National Institute of Rock Mechanics. He is associated mainly with the geological and geotechnical studies of many important engineering projects in the Himalayan region and presently responsible for planning, programming, implementation and monitoring of engineering geological/geotechnical investigations of hydropower projects, communication projects, underground storage plants, underground mines and irrigation projects in India and abroad. He established an innovative technique for conducting stress measurements in fractured and porous rocks for which he is going to get the Patent rights from Controller General, Patents & Designs (India). He is credited with preparing the Stress Map of India for contribution to the World Stress Map.
He has authored more than 60 papers to his credit, published in National and International journals and proceedings and nearly 120 Technical reports and 5 Research projects submitted for various assignments. He is also the Fellow and life member for various National and International societies and associations. He is Editor for 7 International journals and Reviewer for various National and International Magazines. He visited Finland, Sweden, Singapore, Bhutan and Nepal in connection with the Project related works and seminars.
References
- Dyksterhuis S, Albert RA, Müller RD (2005a) Finite-element modelling of contemporary and palaeo-intraplate stress using ABAQUS™. Comput Geosci 31(3):297–307
- Gowd T N, Srirama Rao S V, and Gaur V K 1992 Tectonic Stress Field in Indian Subcontinent; Journal of Geophysical Research, 97, 11879-11888.
- Heidbach O, Reinecker J, Tingay M, Müller B, Sperner B, Fuchs K,Wenzel F (2007) Plate boundary forces are not enough: second and third-order stress patterns highlighted in the World stress map database. Tectonics 26:TC6014
- Heidbach O, Rajabi M, Reiter K, Ziegler M, and the WSM Team 2016 World Stress Map Database Release 2016, GFZ Data Services.
- Jade S, Shrungeshwara TS, Kumar K, Choudhury P, Dumka RK, Bhu H (2017) India plate angular velocity and contemporary deformation rates from continuous GPS measurements from 1996 to 2015. SciRep 7:11439
- Subrahmanyam D S, 2014 Stress provinces of India-contribution of World stress map. Int J Adv Earth Sci Eng 3(1), 108–113.
- Yadav R, and Tiwari V M, 2018 Numerical simulation of present day tectonic stress across the Indian subcontinent. International Journal of Earth Sciences, 107, 2449-2462.
- Zoback ML (1992) First- and second-order patterns of stress in the lithosphere: the world stress map project. J Geophys Res 97(B8):11703
- Zoback, M D, Moos D, Mastin L, and Anderson R N, 1985 Wellbore Breakouts and in situ Stress; Journal of Geophysics Research, 90, 5523-5530.