


CLI India Business Parks

Head, Research
India has long been recognised as a country with immense potential, but it was often hindered by bureaucracy and red tape. In recent years, however, India has made laudable strides, with its economic growth leapfrogging other major countries, in part driven by concerted government-led reforms and sector-focused initiatives that have shaped a more business-friendly climate, particularly for foreign investment.
Today, India has forged ahead into a new era, and the country holds much promise with the largest youth population in the world1 and the second largest labour force2 globally. Investors can look forward to sustained returns from key beneficiaries of these structural advancements, particularly in the Office and Business Park sector.
Five Investment Perspectives into the India Office and Business Park sector
1. India’s Rising Prominence Globally and Regionally
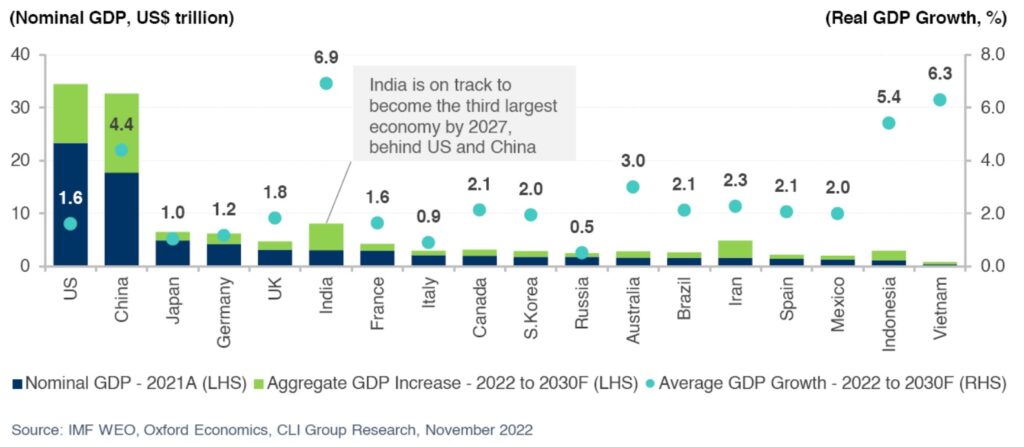
Fast transitioning from its emerging market3 status, India is set to become one of the fastest growing economies in the world, with GDP growth outlook from 2022 to 2030 forecast to be 6.9% (see Figure 1), superseding Vietnam (6.3%), Indonesia (5.4%) and China (4.4%). Anchored by promising macroeconomic fundamentals and an enabling ecosystem, the country is set to accelerate its economic influence on a global scale.
The nation is well-poised to become the third largest economy by 2027, ahead of Japan, Germany, and the UK, and to account for approximately 5% of global GDP by 2030, up from 3% in 2020.
India’s Demographics Provide a Strong Competitive Edge
The biggest enabling factor behind India’s fast- tracked economic growth is its structural demographic advantage.
Largest youth population1 in the world:
- Second most populous country with 1.4 billion people in 2021 and a median age of 28; projected to overtake China as the most populous nation in 20234.
- More than 850 million people under the age of 35 (60% of total population) in 2021, with approximately 360 million people below the age of 15.
- Working age population was estimated at 952 million (68% of total population) in 2021 and is forecast to increase by more than 92 million between 2022 and 20305.
- Deep and educated labour pool with an average of 6.5 million university graduates per annum nationwide, with 2.2 million6 graduates in Science, Technology, Engineering & Mathematics (STEM).
Second largest English-speaking population globally:
- Approximately 10.6%7 of India’s population, or approximately 130 million people, can speak English, with those with higher proficiency situated in larger metro cities8.
Burgeoning middle-class and consumer expenditure:
- The middle-class population is projected to increase from approximately 400 million in 2021 to over 800 million by 20309.
- Nominal consumer spending per capita is projected to rise at a compound annual growth rate (CAGR) of 10.1% between 2022 and 203010.
Outsized urbanisation rate:
- Projected to add 9.4 million urban migrants per annum from 2022 to 2030 with the urbanisation rate expected to reach 39% by 2030, from 35% in 202110.
2. Recent Structural Advancements in India and its Key Beneficiaries
Notable government policies and initiatives have been rolled out nationwide to boost growth in infrastructure and key sectors in recent years. These have helped mitigate some of the key challenges that previously confronted investors, including non- transparent and unpredictable regulatory procedures, and ambiguity in major infrastructure project completions.
The most prominent recent policy changes include:
- National Monetisation Pipeline (NMP11) launched in 2021, to unlock value in brownfield infrastructure projects by engaging the private sector.
- Revision of the Foreign Exchange Management Act (non-debt instruments) in 2021, to allow an increase in the Foreign Direct Investment (FDI) limit from 49% to 74% – and up to 100% for sectors such as infrastructure under the Automatic12 Route.
- Inclusion of more industries under the Production- Linked Scheme (PLI) in 2022, which extends an incentive on incremental sales of goods manufactured in India for a five-year period, aimed at boosting domestic manufacturing and job creation.
- Ongoing structural reforms including the “Digital India” campaign launched by the Government of India, to transform India into a digitally empowered society and knowledge economy.
Earlier, the corporate income tax rates were lowered substantially in 2019, and the wider adoption of the goods and services tax (GST) reform, since its implementation in 2017, has largely reduced barriers for tax reporting and compliance.
Correspondingly, FDI into India has seen a consistent rise in the past decade and is projected to exceed US$100 billion (+29% YoY) in 2022 and to register a 13% CAGR between 2023 and 203013, in part driven by further improvements in the ease of doing business14 in the country and enhancements in foreign trade agreements.
Key Beneficiaries – Technology Sector to Witness the Highest Growth
India is recognised as a key tech hub, with its cities ranked among the top three15 in the Asia Pacific (APAC) region and among the top 1016 globally. It is also the top offshoring destination for IT companies across the world. As a result, sectors such as the Banking, Financial Services and Insurance (BFSI), Business Process Outsourcing (BPO)17 and Knowledge Process Outsourcing (KPO)18 will stand to benefit the most from the national directive towards becoming an even more digitally enabled economy.
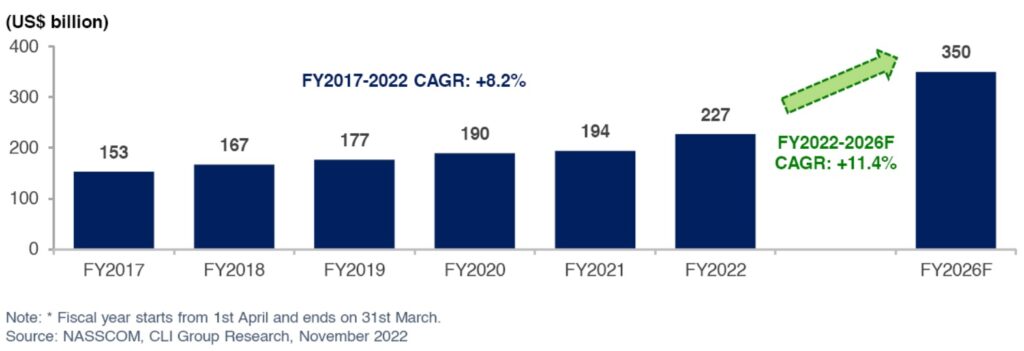
The IT/IT-enabled Services (ITeS) industry accounted for 7.4%19 of India’s GDP in Fiscal Year 2022 (FY2022), and its market share is expected to hit 10% by 2025. Total industry revenue is estimated to have reached US$227 billion in FY2022 (+17% YoY), with further expected growth to US$350 billion by FY2026 (CAGR of +11.4%) (see Figure 2), underpinned by the growing demand for new technologies including cloud and analytics.
Positive Knock-on Effects to Overall Business Landscape and Key Related Sectors
The continued growth of the tech industry, underpinned by favourable structural macroeconomic tailwinds and demographics, should continue to bolster growth for the overall business landscape and key sectors:
- Highly scalable destination for corporates and business operators: Available and affordable labour pool, and competitive operating costs20.
- Beneficiary of deglobalisation: Potential nearshoring and reshoring of manufacturing, production and / or corporate services activities would provide additional boost to businesses.
- Growth of the BFSI industry: Rise of the middle- class, along with the increased adoption of automation and digitalisation, to drive incremental demand for banking and related services including the FinTech sector21.
- Growth of the BPO and KPO Industries: Underpinned by ongoing digital transformation and rise of knowledge enterprises, and further backed by increased enforcement on intellectual property protection amid deglobalisation.
- Talent growth22 still going strong: Technology multinational corporations (MNCs) continue to embark on hiring sprees, as the global demand for ITeS grows on the back of increased use of and permanence of remote working tools, and the development of automation, cloud and artificial intelligence technologies.
Office and Business Park Sector Well- Positioned to Capture Increased Activity
A return to office is underway as occupiers have reopened offices, alongside an uptick in hiring across the ITeS and related sectors. Despite the adoption of ‘work-from-home’ or ‘work-from-anywhere’ policies to various extents by companies globally post-COVID, the nature of the ITeS industry requires a substantial part of its workforce to be onsite, primarily due to: (i) security standards tagged onto network security or
virtual engagement platforms, (ii) work infrastructure (e.g. onsite servers) which requires employees to be present physically to carry out daily tasks.
Occupiers have since adopted certain strategies to address the challenges and changes in work styles that evolved during the pandemic, including an emphasis on digitalisation, sustainability, collaboration, and health and wellness. This includes demand for quality offices and business parks which provide for larger floor plate to accommodate flexible recalibration of layouts as well as technologically enhanced spaces which include touchless technologies and HVAC (heating, ventilation, and air-conditioning) solutions.
3. Dynamics and Landscape of India’s Office and Business Park Sector
There are some distinct differences between office and business park products in India. Offices are typically located in traditional core business districts and areas with proximity to public transportation nodes, and mostly cater to small-to-medium sized corporates in non-IT sectors. Business parks in India are typically information technology (IT) parks that coexist with offices in numerous sub-markets across the nation. They can also be in special economic zones (SEZs) and / or in peripheral districts, and mainly cater to large corporations in the IT sector.
Business parks are usually built on larger land areas compared to offices, allowing a campus-style development with efficient infrastructure and large floor plates, and usually encompass state-of-the-art integrated solutions with office space, retail and a host of recreational amenities.
Business Activity and Office Inventory are Concentrated in the Largest Metro Cities
Total institutional-grade office and business park space was recorded at approximately 728 million23 sq ft across the six largest Tier 1 cities (see Figure 3) in the country, led by Bangalore (27% of total inventory), Delhi NCR (19%) and Mumbai (19%).
In terms of occupier profile, the ITeS sector contributed approximately 35%23 of overall absorption through the first nine months of 2022, followed by Flex Space (14%), BFSI (12%) and the remainder from Other Services24, with the demand base broadly unchanged since pre-COVID.
Sustainability in Offices and Business Parks in India
There is greater emphasis on workspace wellness and sustainability in the post-COVID world, alongside the increased awareness from key industry stakeholders25 who assign higher values to green- certified assets.
This will require asset owners to be more proactive to keep their assets competitive and to futureproof their portfolios, with a longer-term aim to meet their sustainability goals. Correspondingly, landlords are now actively seeking nationally and internationally recognised green certifications26 with a view that potential tenants are increasingly focused on this criterion.
This green transition can be achieved through a combination of initiatives, including leveraging technology and adopting clean renewable energy to power assets27. This, in return, may provide tangible financial benefits that will make these investments more economically viable across the life cycle of buildings.

4. Incremental Capital Markets Liquidity for Offices and Business Parks
With respect to transaction volumes in India, the office sector28 has been the most active asset class and accounted for approximately two-thirds of total transaction volume in the last five years (2017 to 2021). Transactional activities are largely concentrated in the top six Tier 1 Indian cities, with a market share of almost 90% over the same period.
Growing Investment Appetite with Increasingly Diverse Exit Options
With the increased institutionalisation of India’s commercial real estate market in recent years, including the introduction of Real Estate Investment Trusts (REITs) in 2014, the market has since attracted prominent international institutional investors. The successful launch of two commercial REITs during the pandemic attests to the resilience of India’s commercial real estate sector and its appeal to global institutional investors.
Notable transactions by institutional investors include Blackstone’s US$408 million acquisition of Prestige Group’s Cessna Business Park in Bangalore in December 2020 and CPP Investment Board’s (CPPIB) US$371 million acquisition of Tata Group’s
Intellion Park Navi in Mumbai in April 2022. Moreover, the industry witnessed increased acquisitions from listed entities, including Embassy Office Parks REIT and CapitaLand India Trust, over the last two years.
Investment Merits of India Offices and Business Parks
The inherent traits of offices and business parks contribute to the investment viability and attractiveness of the asset class, underpinned by the following:
- Most established asset class with incremental institutional presence in the core Tier 1 cities
- Most resilient asset class through disruptions including during COVID-19
- Investor preference for core office assets that are operational with good nominal rental yield
- Stable recurring revenue streams and income returns
- Long leases with “blue-chip tenants” with periodic inflation-linked adjustments
- Elevated operating margins with utilities costs passed through to customers and chargeable common facilities
- Cost-efficiency
- Tax benefits and incentives from industrial development and promotion policies
- Diverse occupier profile focused in sectors (i.e. ITeS, BPO, KPO, BFSI) that are rapidly expanding

5. Investors Need to be Mindful of Structural Threats Despite the Long-term Potential
Several challenges still cast a shadow over India’s investment landscape, and this has been evidenced by less-than-stellar investment outcomes in the early 2000s. With its emerging market status, India still has catch-up to do in various aspects compared to its regional and global counterparts, including ensuring adequacy of infrastructure, and improving government and financial institutional policies to be more transparent and comprehensive.
However, structural advancements particularly at the policy level, have helped greatly in overcoming some of these challenges and have regained the confidence of prominent investors in recent times. They include some of the largest sovereign wealth investors such as Abu Dhabi Investment Authority, Canada’s CPPIB, Singapore’s GIC and Qatar Investment Authority29, who started to invest more actively in India, across varied asset classes and investment strategies, since 2010.
At the real estate market level, while institutional investment has kept momentum in spite of global economic and geopolitical headwinds, there are further considerations for investors which include: (i) the anticipated global tech sector slowdown; (ii) foreign exchange volatility of the Indian Rupee (INR)30; (iii) non-accretive leverage as a result of high financing costs31; (iv) demand-supply dynamics due to the emerging nature of select micro locations; and (v) capital expenditure into futureproofing assets to incorporate sustainability and digitalisation.
While there is still much room for improvement in enabling greater transparency of doing business in India, particularly for foreign investors, India is taking steps toward fostering a more business-friendly climate and currently sits among the top 1032 most improved countries globally in terms of real estate transparency.
Robust Macroeconomic Environment to Underpin Sustained Demand for Quality Real Assets
The resilient demand for quality real estate and infrastructure products to support the robust growth of the Indian macroeconomy going forward will continue to drive new viable investment opportunities across varied asset classes and the capital stack.
Supported by favourable long-term structural fundamentals including its demographic advantage, and ongoing economic and fiscal reforms, India is strategically positioned to offer attractive absolute total returns, underpinned by ongoing improvements and developments in the real assets industry.
As India continues to grow and develop, it presents an increasingly attractive investment opportunity for investors seeking exposure in this market. However, investing in India can still be complex and challenging. Navigating this market with the right partner with the requisite local market knowledge and network is essential to understanding the socio- political levers, varied demand drivers and underlying real estate fundamentals across India’s many cities and sectors.
Contributing Author:
Tara Wong, Manager, Research
Reference:
- Population below the age of 35, by population count. Source: United Nations, Oxford Economics, November 2022.
- Defined by the working age population as those aged 15 to 64, by population count. Source: United Nations, Oxford Economics, November 2022.
- As classified by multiple institutions including the IMF, S&P, FTSE, Dow Jones, Russell.
- Source: United Nations World Population Prospects 2022.
- Source: United Nations, Oxford Economics, November 2022.
- Average figure over the respective three-year periods between 2017-2018 and 2019-2020. Source: Ministry of Education – All India Survey on Higher Education (AISHE), December 2020.
- India’s 2011 Census estimates. The number of English speakers in India would have increased considerably since then, in-line with the rise in literacy rate from 73% in 2011 to 78% in 2017-2018. Source: National Statistical Office (NSO) Survey, 2020.
- Chennai, Mumbai and Bangalore are cities rated with a “High Proficiency” in English. Source: Education First English Proficiency Index (EF EPI) 2021.
- Middle-class population is defined as people spending between US$11 and US$110 per day in 2011 Purchasing Power Parity (PPP) terms. Source: World Data Lab, April 2021.
- Source: World Bank, United Nations, Oxford Economics, November 2022.
- The aggregate asset pipeline over the four-year period, 2022-2025, is indicatively valued at INR 6.0 lakh crore (~US$73 billion, based on currency conversion sourced from Bloomberg as at 31 October 2022). The top five sectors by estimated value include roads, railways, power, oil & gas pipelines, and telecom. Source: National Portal of India.
- Under the Automatic Route, the foreign investor or the Indian company does not require any approval from the Reserve Bank of India (RBI) or the Government of India for the investment. Source: RBI official website.
- Source: RBI, Oxford Economics, November 2022.
- EIU’s Business Environment Rankings (BERs) 2022 ranked India 54th out of 82 countries for the forecast period 2023-2027, up from 59th in the prior year, and currently ranked higher than China (55th globally) for the first time. India was ranked 12th out of 17 countries in APAC in the same forecast period.
- Source: Cushman & Wakefield’s “Tech Cities 2022: The Global Intersection of Talent and Real Estate”.
- Source: KPMG’s global ranking of leading technology innovation hubs outside of Silicon Valley / San Francisco, 2021.
- BPO is a method of subcontracting select business-related operations (e.g. customer service, accounting, IT) to third-party vendors.
- KPO is the process of outsourcing knowledge intensive activities (e.g. research, consulting) that are data driven and encompass the process of
- gathering, managing, analysing and delivering objective insights into businesses. Source: India Brand Equity Foundation (IBEF), Department of Commerce, Ministry of Commerce and Industry, Government of India.
- For example, the salary of one IT engineer in the US is equivalent to that of 2 IT engineers in Singapore and 13 in India. Source: PayScale, March 2022.
- Market size of India’s FinTech industry is projected to triple from US$50 billion in 2021 to ~US$150 billion in 2025. Source: Invest India, November 2022.
- India’s technology workforce is projected to more than double from 5.1 million in 2021 to over 12.2 million by 2031. Source: Morgan Stanley, “Why This Is India’s Decade”, October 2022.
- Source: CBRE Research, as of 3Q 2022.
- Includes Engineering & Manufacturing, Consulting, E-commerce, Healthcare & Pharmaceuticals.
- Source: CBRE India Office Occupier Survey 2022, July 2022.
- Including Leadership in Energy and Environmental Design (LEED) and Indian Green Building Council (IGBC) certifications.
- Refer to CLI Group Research’s Topical Paper – The Journey to Net Zero Toward a Greener Investment Mandate, October 2022.
- The office sector includes both office and business park transactions, as per Real Capital Analytics’ database.
- CPPIB and GIC established their local offices in Mumbai in 2011 and 2015, respectively; Qatar Investment Authority announced plans in 2021 to open an India office but provided no official timetable. Source: Company press releases and news articles.
- USD/INR depreciated by 3.4% and 3.5% p.a. over the historical 10-year period (2011 to 2021) and 15-year (2006 to 2021) period, respectively. Source: Oxford Economics, November 2022.
- Project level all-in financing costs for real estate are estimated to be in a range of 12-14% per annum as of October 2022. Source: CLI India.
- Source: 2022 edition of JLL and LaSalle’s Global Real Estate Transparency Index.
The research paper is a part of CLI’s research series by Group Research team, in collaboration with CLI Private Equity Real Estate and CLI India teams.