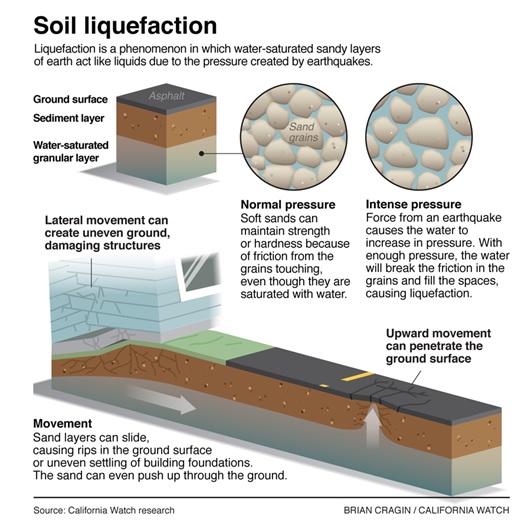
Liquefaction is a devastating manifestation of earthquake. Liquefaction takes place when seismic shear waves pass through a saturated granular soil layer. These shear waves distort the grain structure of soil, and cause its pore spaces to collapse, which in turn increases the pore water pressure. Furthermore, it decreases the shear strength of the soil and the soil will flow like a liquid. Consequently, extensive damages occur. A classic example of this (liquefaction) is 1964 Nigata earthquake (MS = 7.5) in Japan.

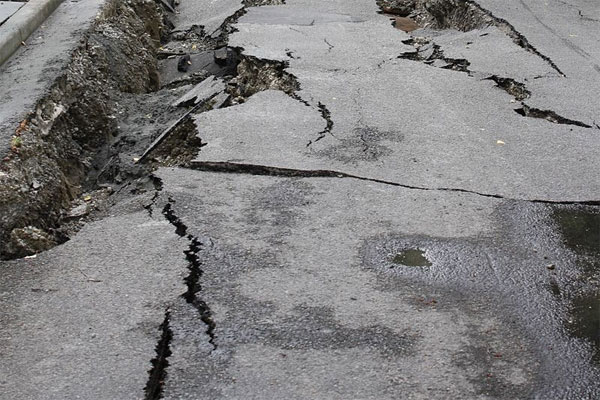
The liquefaction phenomenon is pictorially shown in Figure 1. Some of the photographs showing the devastating effects of liquefaction are shown in Figure 2.

In the present paper the methodology of determination of liquefaction potential of sand in laboratory by using cyclic triaxial testing equipment is discussed.
Sample preparation:
Moist tamping method using an undercompaction procedure (Ladd, 1978) may be used for sample preparation. The void ratio (e) of sand corresponding to a particular relative density Dr (such as 20, 30, and 40 %) would be calculated as
e = emax – Dr (emax – emin )…………Eq. (1)
Where emax and emin are the maximum and minimum void ratios of sand respectively. After evaluating e, dry unit weight may be (γd) determined using
γd = Gs γw / (1 + e) ………………Eq. (2)
Where γw is the unit weight of water and Gs is the specific gravity of sand. The weight of dry sand needed to obtain a specimen of a desired void ratio e, and relative density Dr can be determined using Eq. (2) and noting the volume of the split mould (DeGregorio, 1990). The required amount of oven dried sand should be taken and about 5 % water (Krishnaswamy and Isaac, 1995) shall be added to it. For sample preparation, the entire quantity of sand should be divided into seven parts, and each part shall be carefully transferred into a split mould and compacted using a metal rod until the desired height is achieved. The top of each layer should be scratched slightly before placing the next layer to promote better bonding. Each successive layer would be compacted to an increased percentage of the required unit weight of the specimen. The method consists of placing each layer at a density slightly greater than the density of the layer below it in order to account for the decrease in volume and increase in density that occurs in the lower layers when the new layer is placed (Polito and Martin, 2001). The procedure consists of pouring increasing amounts of soils for constant height successive layers. Using this method, the compaction of each succeeding layer could further densify the soil below it, and therefore a relatively uniform specimen may be obtained (Amini, 2000). After the sample is prepared, a vacuum (of about 4 kPa) should be applied to the specimen in order to provide the requisite stability and mould will be dismantled.
Test procedure:

After assembling the triaxial cell and filling it with water, the cell pressure should be increased and the vacuum pressure should be simultaneously decreased. Then distilled de-aired water shall be flushed with a low pressure (1 – 3 kPa) from the bottom towards the top of the specimen until the total quantity of water circulating through the sample is at least twice the initial volume of the sample (Noorzad and Amini, 2014). Subsequently, a back pressure up to 300 kPa (Krishnaswamy and Isaac, 1995; Noorzad and Amini, 2014) will be applied to achieve the saturation. An effective confining pressure of 50 kPa shall be maintained for 1 hr to attain proper saturation without disturbing the soil structure. Saturation would be ensured when the value of the pore pressure parameter “B” is at least 0.95. Then the specimen will be isotropically consolidated to a desired confining pressure. Different effective confining pressures (such as 50, 100, 200 kPa) may be used. After the consolidation process is completed, cyclic triaxial test can be performed under undrained condition. The axial loads, vertical displacements and pore pressure should be recorded at periodic intervals of 0.001 second, for the applied sinusoidal waveform with the frequency of 1 Hz. Liquefaction would be considered to occur when the pore pressure ratio becomes 1 (Kramer, 1996) or when double amplitude axial strain during cyclic loading becomes equal to 5 % (Noorzad and Amini, 2014).
Analysis to be done:
The effects of confining pressure, and relative density on the phenomenon of liquefaction can be studied. Also the variation of normalized shear modulus (G/Gmax) with number of cycles may be observed. Shear modulus (G) shall be calculated from the slope of the line connecting the maximum and minimum points of the loops (corresponding to different cycles) of shear strain vs. shear stress plots. The maximum shear modulus (Gmax) shall be calculated by the following equation (Kramer, 1996).
Gmax = 625 F(e) (OCR)k pa(1-n)(σ’m)n …………Eq. (3)
Where F(e) = a function of the void ratio (e), OCR = over consolidation ratio, σ’m = mean principal effective stress, n = stress exponent which is often taken as 0.5, pa = atmospheric pressure in the same unit as σ’m and Gmax ; k = overconsolidation ratio exponent, its value may be taken as zero for sand (Hardin and Drnevich, 1972). The value of pa may be taken as 98 kPa (Towhata, 2008). The value of function F(e) may be evaluated by the following equation (Hardin, 1978),
F(e) = 1 / (0.3 + 0.7e2) …………Eq. (4)
Substituting Eq. (4) in Eq. (3) and simplifying leads to Eq. (5) as mentioned below:
Gmax = 625 x [1 / (0.3 + 0.7e2) ] x (pa x σ’m)0.5 …………Eq. (5)
Additionally, the effects of size of specimens (38, 50, 75, or 100 mm diameter) on liquefaction may be investigated using split moulds of different sizes.
References:
- Amini, F. (2000). “Effect of silt content on liquefaction of uniform silty sands.” J. Geotech. Geoenv. Eng., 126 (3), 208-217.
- DeGregorio, V.B. (1990). “Loading systems, Sample preparation, and Liquefaction.” J. Geotech. Eng., 116, 805-821.
- Hardin, B.O. (1978). “The nature of stress-strain behaviour of soils.” Proc. Earthquake Engg. and Soil Dynamics, ASCE, Pasadena, California, Vol. 1, 3-89.
- Hardin, B.O., Drnevich, V.P. (1972). “Shear modulus and damping in soils: Design equations and curves.” Journal of Soil Mechanics and Found., Asce, 98(7), 667-692.
- Kramer, S.L. (1996). “Geotechnical Earthquake Engineering”, Pearson Education (Singapore) Pvt. Ltd.
- Krishnaswamy, N.R., Isaac, N.T. (1995). “Liquefaction analysis of saturated reinforced granular soils.” J. Geotech. Eng. ASCE, 121(9), 645- 651.
- Ladd, R.S. (1978). “Preparing test specimen using undercompaction.” Geotech. Test. J., ASTM, 1(1), 16-23.
- Noorzad, R., Amini, P.F. (2014). “Liquefaction resistance of Babolsar sand reinforced with randomly distributed fibers under cyclic loading.” Soil Dyn. Earthq. Eng., 66, 281-292.
- Polito, C.P., Martin, J.R. (2001). “Effects of nonplastic fines on the liquefaction resistance of sands.” J. Geotech. Geoenv. Eng., ASCE, 127 (5), 408-415.
- Towhata, I. (2008). “Geotechnical Earthquake Engineering.” Springer-Verlag, Berlin, Heidelberg.
Authored By;

Dr. Siddhartha Sengupta, Associate Professor, Civil & Environmental Engineering, Birla Institute of Technology, Mesra, Ranchi


