Office vacancy levels remained range bound during Q1 2023, in line with the Q4 2022 levels, pointing to a resilient commercial office market. During Q1 2023, while the office market witnessed softer demand, it had little impact on the vacancy levels. While 2022 saw a robust demand with occupiers going ahead with their expansion plans after a 2-year long wait-and-watch scenario, market activity softened in Q1 2023 amidst the looming recessionary concerns and economic headwinds.
New supply largely traded alongside demand in most of the markets, resulting in stable vacancy levels. When compared from a year-ago, vacancy levels dropped by 210 basis points with demand making a massive comeback.
Though the leasing activity in Q1 2023, witnessed a drop of 19% YoY at 10.1 mn sq ft, the market is likely to pick up in the latter part of the year, driven by strong growth fundamentals. While the office market has a strong supply pipeline, developers will be more careful & cautious basis how the demand pans out going ahead, thereby avoiding speculative supply.

Trends in Pan India Grade A-Office Vacancy levels (in %)
| Quarter-Year | Q1 2022 | Q2 2022 | Q3 2022 | Q4 2022 | Q1 2023 |
| Vacancy (%) | 18.5% | 17.0% | 16.7% | 16.4% | 16.4% |
Source: Colliers
“At a time when occupiers are delaying decision making on leasing office spaces amidst continued economic uncertainties, the office market witnesses signs of stability in Q1 2023 with the vacancy levels remaining intact at 16.4% compared to the previous quarter. Going ahead, we expect demand and supply to move in unison, keeping the vacancy and rental levels range bound. The latter part of 2023 may see signs of strong recovery provided the recessionary concerns lessen in the beginning of the second half of 2023,” says Peush Jain, Managing Director, Office services, India, Colliers.
Vacancy levels in Delhi NCR, Hyderabad and Pune slightly rise on sequential basis
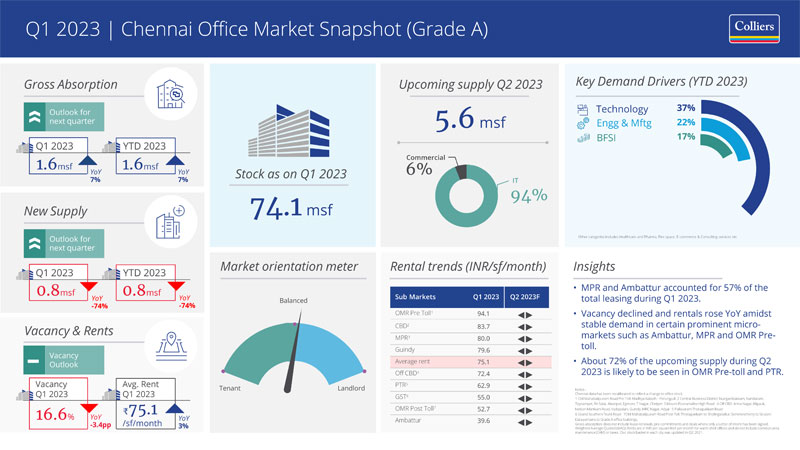
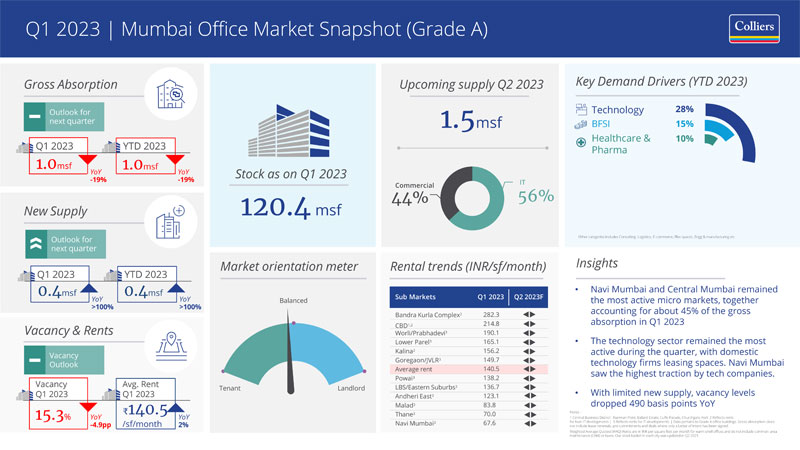
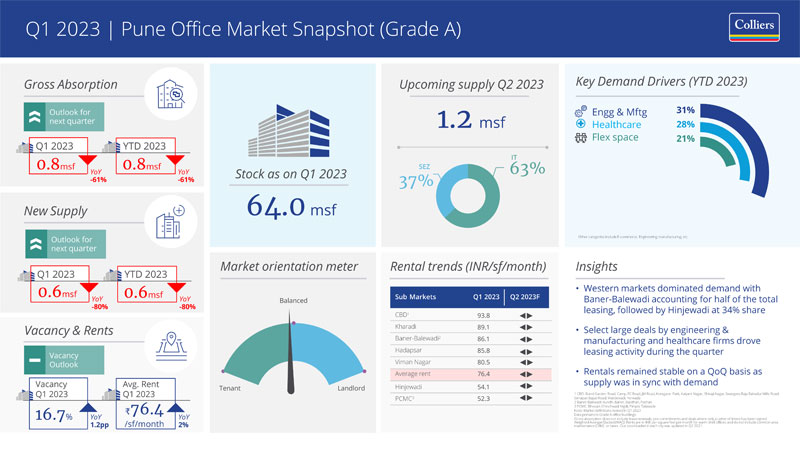
Vacancy levels in half of the top six cities across Pan India during Q1 2023 remained in line with Q4 2022 levels indicating a guarded yet strategic stance across markets. Hyderabad, Delhi NCR, and Pune witnessed a slight rise in vacancy levels owing to a significant supply infusion in the respective cities during 2022. Vacancy in Mumbai which dropped to 15.3% by the end of 2022, continued to remain stable in Q1 2023 due to limited availability of new supply paired with steady demand in the city.
City-wise trends in Grade A-Office Vacancy levels (in %)
| City | Vacancy Q4 2022 | Vacancy Q1 2023 |
| Bengaluru | 12.7% | 12.8% |
| Chennai | 19.9% | 16.6%* |
| Delhi NCR | 19.6% | 20.0% |
| Hyderabad | 18.6% | 19.9% |
| Mumbai | 15.3% | 15.3% |
| Pune | 16.2% | 16.7% |
*Note: The Grade A stock for Chennai was recalibrated in Q1 2023, as per prevailing market conditions
Source: Colliers


Leasing by technology companies and flex space operators almost neck-to-neck in Q1 2023
During Q1 2023, leasing by flex space operators inched closer to that of technology companies for the first time ever. Flex occupiers leased 2.1 mn sq feet of space during Q1 2023, accounting for 20%, few paces behind the technology sector’s share at 22%. Together both the sectors accounted for nearly 42% of the total leasing across top 6 cities. Occupiers’ interest in flex spaces remain unabated as they continue to blend their conventional real estate portfolio in a bid to control costs while providing convenient ways to work for their employees. Large technology occupiers have also been leasing spaces in flex spaces due to their added benefits such as flexible lease terms, lower capex, and modern workplace designs. This coupled with ongoing recessionary concerns and layoffs in technology sector has led to a relative pushback in conventional leasing by these occupiers.
About Colliers
Colliers (NASDAQ, TSX: CIGI) is a leading diversified professional services and investment management company. With operations in 67 countries, our more than 15,000 enterprising professionals work collaboratively to provide expert advice to real estate occupiers, owners and investors. For more than 25 years, our experienced leadership with significant insider ownership has delivered compound annual investment returns of almost 20% for shareholders. With annualised revenues of $3.0 billion ($3.3 billion including affiliates) and $40 billion of assets under management, we maximise the potential of property and accelerate the success of our clients and our people.


